11 Best Free KPI Dashboard Software for Every Business
Looking for the best free KPI dashboard software? Trying to establish how your business is performing can take time and effort, and dashboards often seem overly complex and expensive.
Let’s look at the best free KPI dashboard tools to better understand your business’s performance and create more long-term growth.
What are Key Performance Indicators?
First of all, let’s define what key performance indicators are. KPIs help businesses track progress toward specific objectives. You can use KPIs to get insight into your company’s marketing efforts and they also form a key component of any SEO strategy
Why Should You Track KPIs?
For many reasons! Businesses often overlook tracking KPIs when they experience growth, which is picked up when growth slows. However, it may already be too late to save it!
Here are some of the main reasons to track KPIs:
Monitor progress toward goals: The main benefit of KPI software is that it allows you to track whether or not your business is on track to reach its goals. Say, for example, you run a gym business. If your goal is to run a marketing campaign that increases memberships, a KPI dashboard can help you track how well the campaign is performing and whether or not your memberships will reach the desired number.
Identify opportunities to improve: A good KPI dashboard allows you to establish where improvements can be made and constantly track your brand’s progress. Using our gym example again, you might notice that your campaign drives many people to your company website, but only a few are converting into members. To counter this, look at your on-page customer journey to see how it could be streamlined and improved to improve your conversion rate.
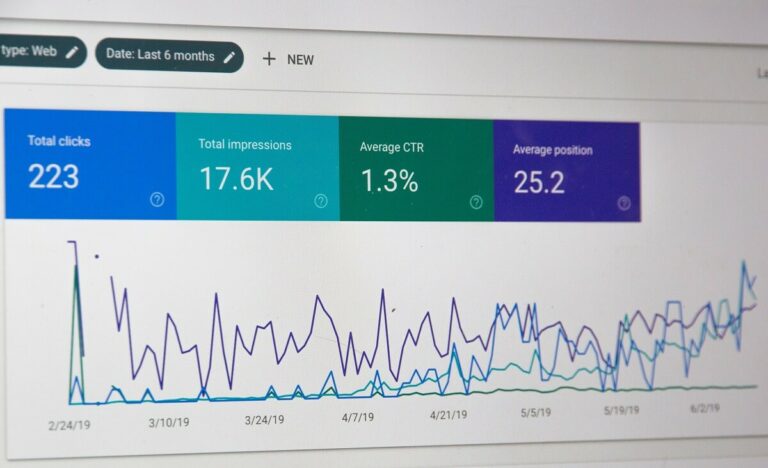
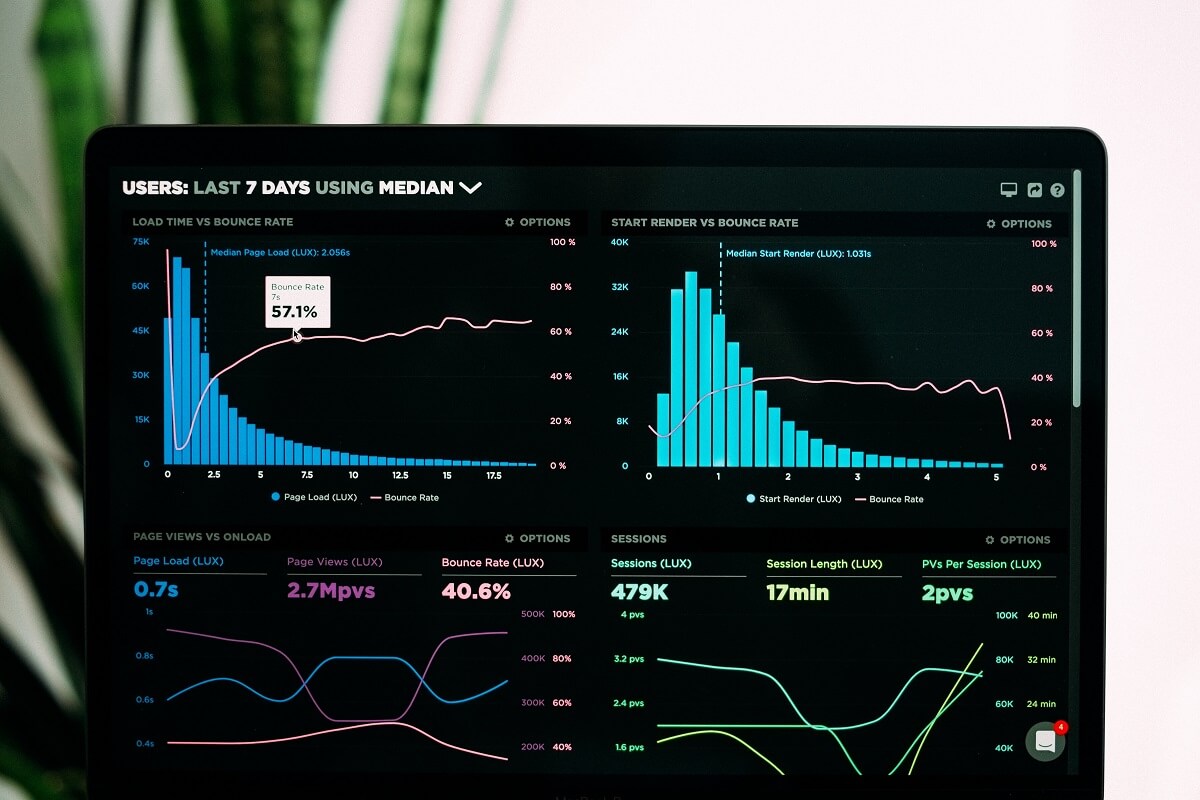
Visualize performance: Top-quality KPI software generates data in formats such as graphs and reports to oversee the brand’s performance. If your business starts to sell plenty of products, nothing is more satisfying than watching that line start to uptick! Equally, having a visual image of the line beginning to plateau or fall will allow you to tackle any issues immediately rather than waiting until it’s too late.
Make data-driven decisions: KPI software can help by providing business owners quick access to their KPIs. There is a time and place for human intuition when making big business decisions. However, nothing is better or safer than making decisions based on cold, hard data.
Measure marketing efforts: KPI software can also help you measure the effectiveness of your marketing efforts and track progress over time. KPI dashboard software will allow you to track the performance of new launches in the short term and over a longer period. This information will help you establish the lifetime value of your products and when you need to consider bringing out new designs to keep demand high.
Improve customer experiences: Not only does KPI software allow you to track performance from a brand perspective, but it also allows you to make decisions that suit your customers. Using our examples, creating a better join page will make gym members happier, and launching new t-shirt designs when customers want them will only add to brand success.
Learn customer behavior: Knowing your target audience is essential for any business to grow. Not only will it help you satisfy your current customers, but it will also show you who you should try and get as new customers.
Measure performance against competitors: Have you ever scratched your head, trying to understand how your competition has gained so much success while your brand struggles? KPI software can help you see what they are doing right and where you can improve to start competing with them more fiercely.
What to Look for in Free Dashboard Software
Ease of Use: Any KPI software you choose must be quick and easy to use so that you can gather the data you need quickly and start executing the necessary changes. It doesn’t matter if you have the most advanced software in the world. If you don’t know how to log in and use it, it’s pointless! That’s why we always recommend you use a free trial before spending your hard-earned cash on a software dashboard you may not like.
Customization Options: Every business is different, and therefore every business needs its unique dashboard. A charity shop will have very different Key Performance Indicators and requirements from a socks company, and their dashboards should reflect those differences.
Data Connections: You should only use a KPI dashboard to connect to highly-used databases. Even if the dashboard looks clear and crisp, it will only be useful if you can integrate your data. All the KPI dashboard software in our list plug into the leading data connections.
Security & Reliability: Any software containing highly confidential data must be secure and reliable. You don’t want anyone outside your business to gather your company information or, even worse, share it with your competitors.
What are the best free KPI Dashboard software tools?
1. Databox
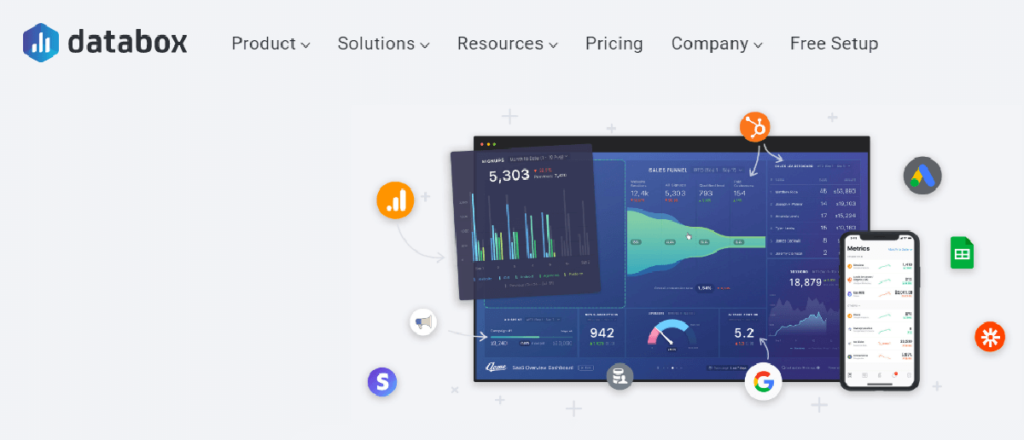
First on the list is Databox, a KPI dashboard that is excellent for visualizing data and has an easy-to-use user experience. It is a free KPI software that helps you measure your business KPIs, set performance targets, and analyze data in real time. One of the reasons Databox is so popular is that you can choose from over 300 pre-built dashboards to get started, allowing even complete beginners to achieve data visualization, even for complex data.
Databox also provides a Performance Score feature, which shows the overall health of your business and helps you identify weak spots. It also allows you to track every client’s top KPI in one place with our KPI Tracker. With Databox, you can easily and effectively measure and improve your business performance over time.
There are over 70 one-click integrations, such as Google Analytics, Hubspot, Google Search Console, Ahrefs, Zapier, Semrush, and others.
Are you concerned about finding your way around Key Performance Indicator dashboards and adding small aspects that will customize your page?
Databox makes things simple with a drag-and-drop feature that makes it quick and easy to design dashboards, even if you are a data novice.
Key Features
Excellent visualization, simple UI, and quickstart templates.
Pricing
Databox has four plans:
- Free
- Starter $72/month
- Professional $135/month
- Performer $231/month
You can use the free version for 3 data connections only. See full pricing here.
2. Google Analytics
Next up is one of the most popular choices for marketers and businesses. As a Google product, the Google Analytics platform is an excellent KPI software for data integration and visualization.
Google Analytics offers several interactive dashboards for data visualization, including advertising reports, behavior reports, acquisition reports, and conversion reports.
As expected, Google Analytics is the easiest dashboard software to integrate with other Google products, making tracking all your data in one place easy.
Thanks to tag management support, data import options, custom variables, calculated metrics, custom metrics, and custom dimensions, it is so easy to manage and collect data in Google Analytics.
Key Features
Elite-level website visitor tracking, specific detailed reports, and simplicity.
Pricing
Free
3. Google Looker Studio
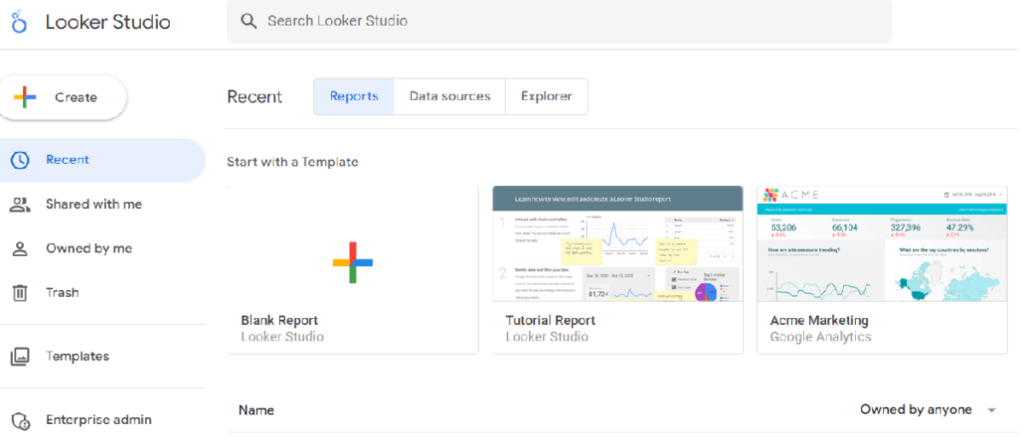
Google Looker Studio pulls together data quickly and easily. With over 300 integrations to use to create dashboards and gather business intelligence, it is an excellent analytics solution.
There are over 33 ways you can set up your marketing data in custom dashboards, allowing you to display data in a way that suits you. These variations also work just as well on mobile phones and make Google Looker Studio a fantastic choice for interactive data visualizations.
Publishing reports and dashboards in Google Data Studio is also quick and easy. You can add colleagues via their email addresses and set what permissions they have.
So if you just want someone to see key performance metrics, you can set them as “view only,” but if you want a data guru to come in and analyze business data, you can give them editing rights.
Google Looker Studio offers drill-down capabilities, PDF and Excel exports, real-time collaborations, and shareable dashboards.
Key Features
Seamless Google integration, drag and drop interface, and simple to analyze data.
Pricing
Free
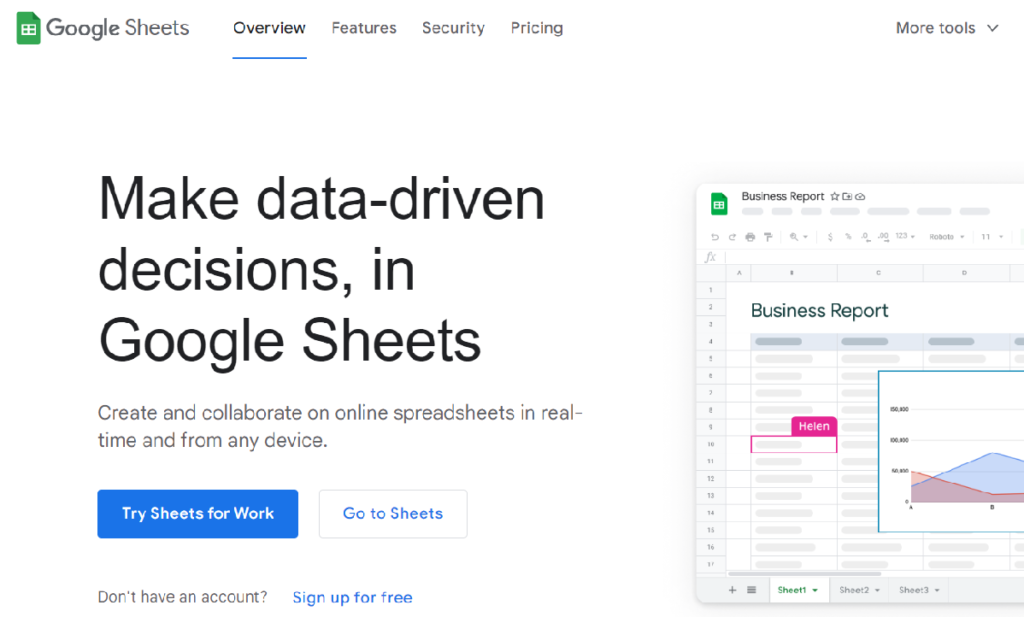
Another excellent option for data visualization and KPI dashboards is Google Sheets. Google Sheets may not be the most complex business intelligence tool on this list, but it is one of the easiest to use, which is ideal for beginners who want a simple way to visualize complex data.
Google Sheets is an excellent business intelligence platform for anyone looking for an ideal collaboration option. As with other tools in Google, Google Sheets allows you to collaborate in real time rather than spending time sharing data over email.
Key Features
Simple format, perfect for beginners. Quick and easy to store and track data.
Pricing
Free
5. Klipfolio
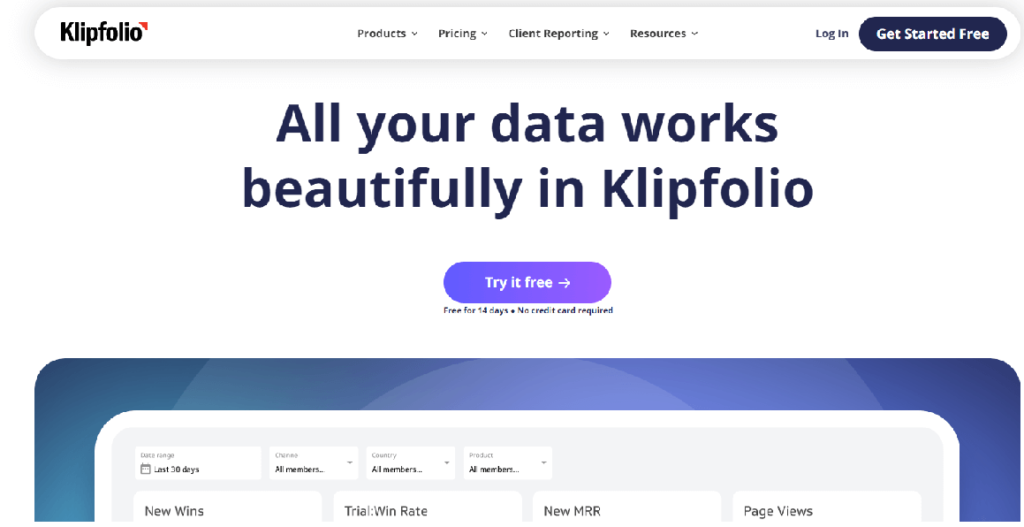
Next, we have Klipfolio, another excellent free analytics platform for you to import data and review.
Klipfolio is also excellent for data analysis and ideal for anyone looking for interactive dashboards.
One reason it is so popular is because of how easy it is to pull all your data into complex dashboards. The plug-and-play system ensures any integration is quick and easy, and you don’t need to be a coding wizard to set up your ideal data visualization page.
Drag and drop your content from any of the most popular data sources, such as Facebook, Google Ads, Hubspot, and Shopify.
Like Databox, Klipfolio offers several templates which offer the perfect starting point for your dashboard.
This tool’s other most popular elements include real-time analytics, PDF exports, alerts and notifications, and ETL capability.
Key Features
One-click integrations, automatic updates, and client management products.
Pricing
- Free
- Go
- Pro
- Business
6. Microsoft Power BI

Next, let’s look at the biggest competitor to Google Analytics, Microsoft Power BI, a cloud-based KPI software that helps you collect and analyze data to make informed business decisions. This business intelligence software monitors essential organizational data, allowing you to transform data with interactive tools, essential for the finance, operations, marketing, and sales industries. With an ever-increasing amount of data to process and interpret, it can be easy to quickly filter and view granular data sets with accurately configured reporting figures.
One of the reasons Microsoft Power BI is a great option is because of how easy it is to set up, and you can import data from several sources, both online and from the Microsoft Suite.
What stands out with Power BI is the question-and-answer feature, making it easy to navigate the business intelligence dashboard.
Microsoft Power BI provides a collaborative framework and automatic data refreshes, and you can even track your performance on the go via the Power BI mobile app.
Key Features
Microsoft Power BI provides a self-service portal for creating dashboards to showcase key performance indicators or KPIs and automatically refreshes the data so that it can be viewed in real-time. It is also integrated with Microsoft Office 365 and makes it easy to share reports via email or embed them on websites.
Another great feature of Microsoft Power BI is its collaborative framework, which allows businesses to work together on a single project and collaborate on the analysis of data. It also has an intuitive design that makes it easy for anyone to use the software, even if they are not technologically savvy.
The last key feature of Microsoft Power BI is its dataset filtration option, which allows users to limit the types of data they see in their dashboard. These excellent filtering options help you get granular data and pull data from several custom data sources. This prevents you from seeing unnecessary information and helps you focus on only the most important aspects of your business. Overall, Microsoft Power BI is a great tool for organizations looking to improve their overall business performance by tracking key metrics using KPIs.
Pricing
$10 per month
7. Mixpanel
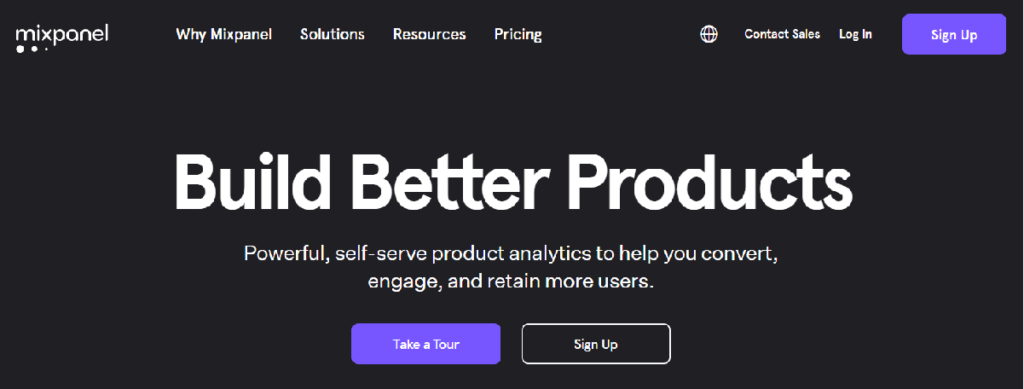
Another viable option is Mixpanel, a KPI dashboard designed explicitly for product analytics. It has a free option to help you analyze, measure, and improve your business’s online performance.
Here, you can build funnels and identify top customer types, even if you are not a data expert.
The great aspect of Mixpanel is the fact that you get a lot of usability out of the free version. Some free version offers limited capabilities, but Mixpanel offers 100k monthly tracked users as part of their free option.
Another benefit Mixpanel offers users is predictive analytics, not to mention website analytics and geotargeting. These additional features make Mixpanel a unique offering you should definitely check out. The dashboard allows users to view key metrics such as conversion rate, bounces, and time on site for every page of their website.
It has several built-in funnels that allow you to run automated marketing campaigns and track the performance of your efforts in real time. These insights can be invaluable for identifying new opportunities or areas for improvement in your business operations.
Key Features
Mixpanel offers several other features, such as custom segmentation, advanced reporting, and mobile app integration. It offers various data visualization options, including heat maps, funnel reports, and user flows, to help businesses make informed decisions about their digital marketing strategies.
For example, it has several built-in funnels that allow companies to run automated marketing campaigns and track the performance of their efforts in real time. These insights can be invaluable for identifying new opportunities or areas for improvement in your business’s operations.
Pricing
- Free
- Growth ($25/month)
- Enterprise (contact sales team)
8. Tableau

Tableau is needed for companies that heavily rely on Microsoft Excel. It is a powerful business intelligence (BI) and KPI dashboard tool that helps businesses make data-driven decisions by drawing insights from various sources, such as internal systems, external websites, and other applications. Its drag-and-drop user interface makes it easy for business users to create visualizations using Tableau’s powerful analytics tools.
Key Features
Designed to offer data visualization for Excel spreadsheets.
If Microsoft Excel is the main data source for your business, Tableau could be an excellent option for creating customizable dashboards, as it is designed specifically to work with Excel.
The drag-and-drop interface makes it easy to get a quick overview of business KPIs and establish performance.
It also works well across devices; you can set automated alerts for your PC or mobile phone.
Tableau is another platform that offers drag-and-drop functionality, no matter what device you use.
Tableau is also fantastic at handling large volumes of data without the dashboard speed suffering.
Other useful features include advanced chart types, predictive analysis, and role-based permissions.
Tableau also has a mobile app that is accessible on smartphones and tablets, making it easy to view and analyze data on the go. With Tableau, businesses can identify trends and make informed decisions in real-time by using predictive analysis tools, which help them predict when certain events are likely to occur or how certain outcomes may affect their business.
Pricing
Tableau has 3 packages:
- Free
- Tableau Viewer 15$/month
- Tableau Explorer 42$/month
- Tableau Creator 70$/month
Tableau is an ideal choice for any business looking to gain a better understanding of its current performance and how it fits into the larger market landscape.
9. GoodData
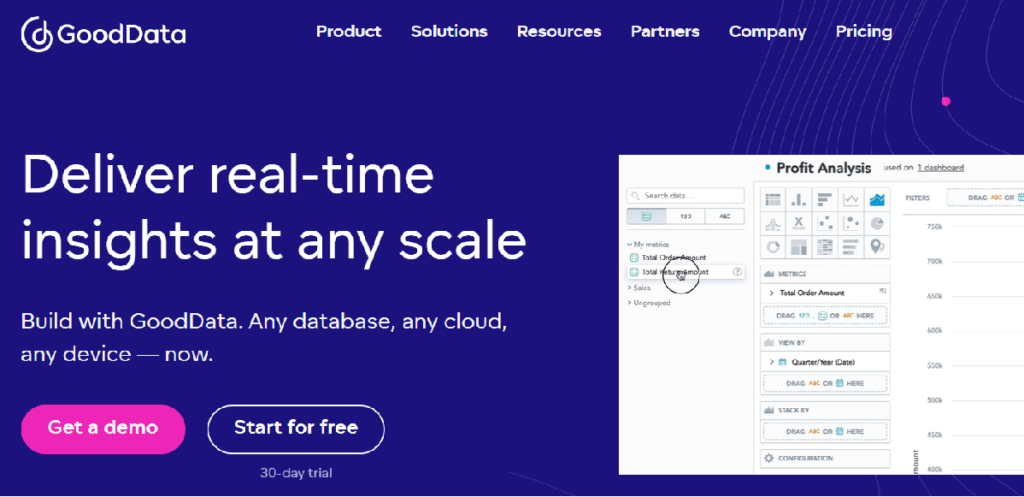
If you are searching for a highly detailed KPI dashboard, consider GoodData. GoodData data analytics and reporting solutions can be invaluable for mid-sized to large businesses in today’s ever-changing technological landscape.
It is a cloud-based KPI dashboard software that helps businesses analyze and visualize data from any source. It provides predictive analytics to identify the causes of business trends and make informed decisions. GoodData also offers drill-down analysis, which allows users to view detailed information about specific KPI values. It can be easily customized with a variety of templates and widgets to suit various business needs.
GoodData allows you to create insightful dashboards for quick data visualization and more detailed and complex data modeling. This software lets you see data in real time on the analytic dashboard, letting you gather insights as they unfold.
GoodData also provides detailed analysis of KPIs using different perspectives like time series or comparing them across teams. As a white-label solution for businesses, GoodData can be customized to suit the brand’s specific needs.
Key Features
Highly detailed KPI dashboard tool, interactive KPI reports, compatible with multiple data sources.
Pricing
30-day free trial
You can ask for details on prices by requesting a demo of this KPI dashboard tool.
10. Zoho Analytics
Zoho Analytics is a great option for anyone searching for a cheaper option to help teams make effective business decisions and improve business performance. It is best suited for professionals like marketing, finance, or sales teams who need budget-friendly analytics tools to scale up their business.
You can integrate from more than 250 data sources, and there is an “Ask Zia” option, which acts as an AI data analyst, and helps you turn your raw data into simple and easy-to-understand dashboards.
Zoho Analytics also has access control, unified business insights, and embedded BI.
Key Features
Zoho Analytics helps you to keep track of your most vital business data and make informed decisions through powerful analytics. It has a detailed data-management dashboard, perfect for establishing connections and correlations. The built-in reporting features allow you to create custom reports, analyze your data in various ways, and share it with others easily. Zoho Analytics also has several predefined reports that can be customized further to meet specific needs.
Zoho Analytics comes with several pre-built dashboards, but you can also create your own dashboards by adding additional charts and widgets. You can set up various parameters to measure the KPIs in your business, such as the number of orders shipped, revenue per customer, etc. The insights provided by Zoho Analytics help you identify problems in your business and take corrective measures faster.
Pricing
- 15-day free trial
- Basic: $24/month
- Standard: $48/month
- Premium: $115/month
- Enterprise: $455/month
11. Amplitude
Being a product team or marketer requires a great deal of strategy, innovation, and collaboration. It can be difficult to know what methods will work best for a given team or project. To help make this process easier, Amplitude Analytics offers features that are best suited for product teams and marketers.
This tool is excellent for establishing customer intent behind actions and lets you create beautiful KPI dashboards to track all the data you have on your customers.
If you want to look deeper into behavioral information, Amplitude Analytics is an excellent option, as it easily displays the intent and context behind each customer action.
Key Features
Detailed reports on user behavior and customer intent.
- Behavior tracking and analytics: This feature allows businesses to track specific actions taken by users and analyze the data to identify trends and make informed decisions.
- Amplitude Analytics integrates with popular products like Google Analytics, MixPanel, and KissMetrics so that product teams can access data regarding their specific industry or product.
- Amplitude Analytics also provides tools for making data-backed decisions, such as segmentation and analysis of user behavior.
Pricing
- Starter
- Growth
- Enterprise
Final Thoughts on The 11 Best Free KPI Dashboard Software Tools
The right KPI dashboard software can significantly impact your brand’s growth. Rather than blindly making decisions for your company that may or may not pay off, you can use the information on offer to make educated decisions and ensure your brand continues to prosper.
Give the free trials and go and see which suits your brand the most!
Frequently Asked Questions on the Best Free KPI Dashboard Software Tools
How do I set up a KPI dashboard?
Setting up a KPI dashboard is quite easy. All you need to do is decide on the specific metrics you want to track. Then, select the appropriate KPI dashboard software tool and customize the dashboard to your specific needs and add the relevant data sources.
How can a KPI dashboard help you improve your website’s SEO?
One of the main benefits of a top-quality KPI dashboard is that it visually represents your data, making it easier to track any aspects relevant to your business’s success, such as conversions or website visits.
What are the advantages of using a KPI dashboard?
There are several advantages to using a KPI dashboard. It offers a visual representation of your website’s performance. Secondly, you can use it to identify trends. Lastly, a KPI board ensures you can quickly evaluate performance and follow winning strategies or ones that need more work.